As Field CTO for an observability solution, I am constantly looking for new ways to present and utilize the data. Due to my job, my house is also networked and generates data in the various systems that have so far remained unused.
With the installation of our photovoltaic system, we were curious to see how much electricity we could now produce, store and consume ourselves. Yes, the manufacturer’s app also had the information, but I wanted to combine this data with our smart meters and smart plugs. A data collector was quickly installed, connected to a data lake and a dashboard created:
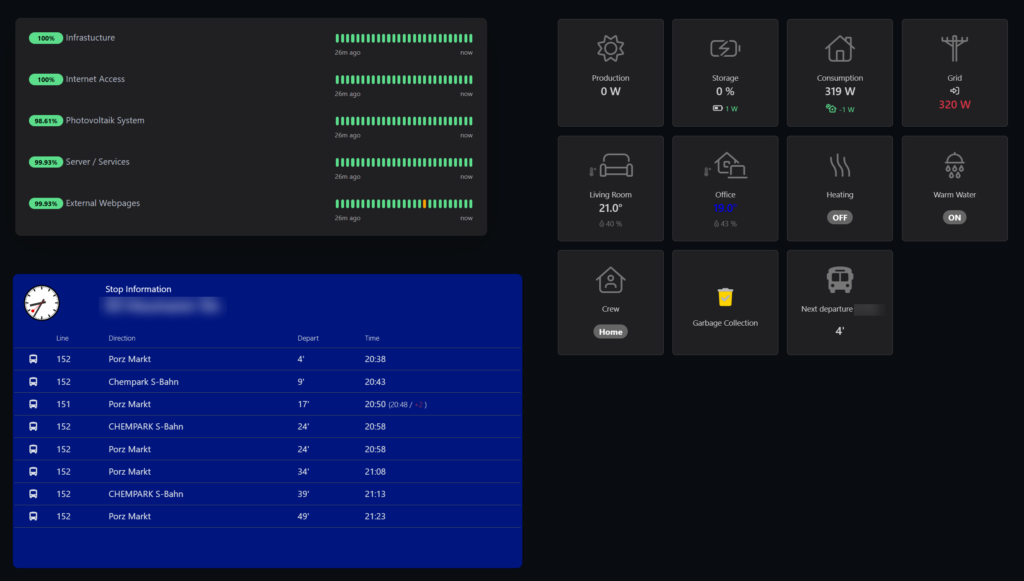
It happened to us that we forgot to put the garbage can at the side of the road on time. A neighbor who works for the local waste disposal company recently told me that there is a public API where anyone can check their collection dates. Another collector was quickly activated, and the data added to the dashboard.
I was also able to solve a second problem with data: The app for our public transportation is not the best and cannot always display delays. Here, too, there is a public API that I use to display the current departure times of our bus stop together with the delays and the next departure to our center.
The project is now continuing: next I plan to display the dashboard on a monitor with a wooden frame using a Raspberry Pi.
Keep you updated…
